
A practical API debugging loop: OpenAPI, Postman, HAR, jq, and JSONPath
A hands-on API debugging workflow with OpenAPI sequence previews, Postman request order checks, HAR waterfalls, jq filters, JSONPath extraction, and HTTP header review.
The real debugging problem
API bugs rarely live in one file. The OpenAPI contract says one thing, the Postman collection sends another order of requests, the browser HAR shows a slow third-party call, and the frontend only reports a vague timeout.
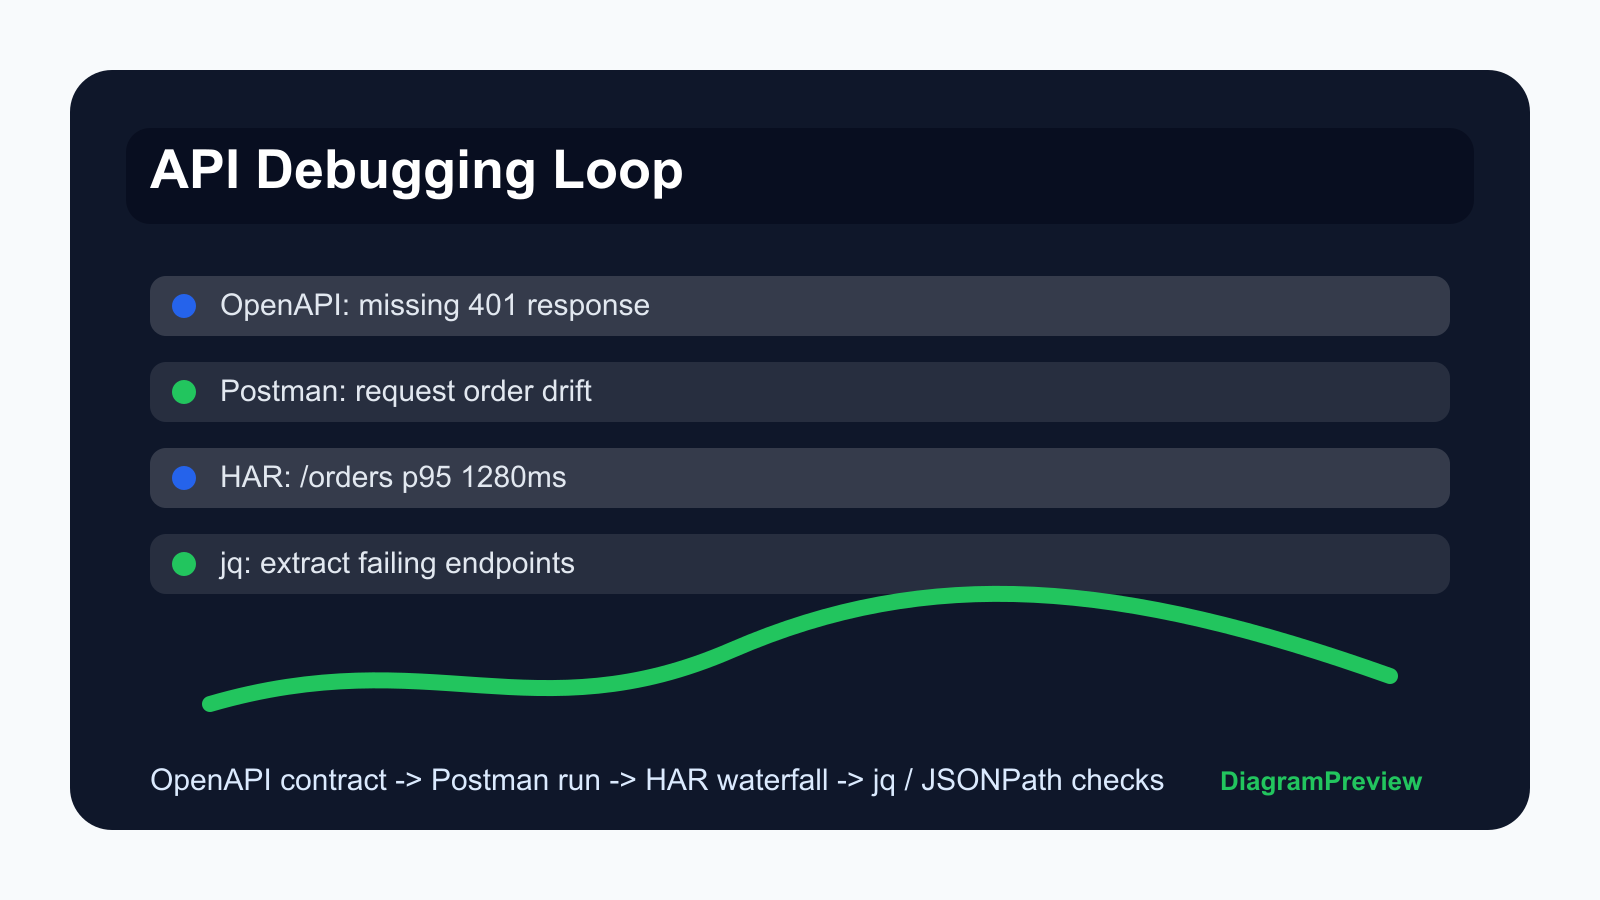
A useful API debugging article should not stop at a sequence diagram. It should show how to move from contract, to request collection, to browser traffic, to response filtering, then to the final note you put in an issue or PR.
Demo 1: start from the OpenAPI contract
Begin with the route contract because it tells you which happy path and error path should exist. In many incidents, the missing part is not the 200 response, but the undocumented 401, 409, 422, or 429 branch.
Paste a small OpenAPI fragment first. If the preview is readable, expand to the endpoint group instead of the whole API spec.
paths:
  /orders:
    post:
      summary: Create order
      responses:
        "201":
          description: Created
        "409":
          description: Duplicate payment intent
        "422":
description: Invalid cart stateDemo 2: compare the Postman request order
Postman collections are useful because they show the order people actually run during manual testing. A contract can be correct while the collection is stale.
The preview should answer a simple question: does the collection call auth, cart validation, order creation, and order status in the same order as the product flow?
{
  "item": [
    {"name": "Login", "request": {"method": "POST", "url": "https://api.example.com/auth/login"}},
    {"name": "Validate cart", "request": {"method": "POST", "url": "https://api.example.com/cart/validate"}},
    {"name": "Create order", "request": {"method": "POST", "url": "https://api.example.com/orders"}}
  ]
}Demo 3: use HAR to find the expensive request
The HAR file is where the browser tells the truth. It shows redirects, static assets, third-party scripts, status codes, and wait time in the same timeline.
Do not paste the whole production HAR into a ticket first. Extract the slowest three or four entries, preview them, and use that screenshot as the first debugging artifact.
{
  "log": {
    "entries": [
      {"time": 92, "request": {"method": "GET", "url": "https://app.example.com/checkout"}, "response": {"status": 200}},
      {"time": 1280, "request": {"method": "POST", "url": "https://api.example.com/orders"}, "response": {"status": 201}},
      {"time": 430, "request": {"method": "GET", "url": "https://analytics.example.net/tag.js"}, "response": {"status": 200}}
    ]
  }
}Demo 4: extract evidence with jq and JSONPath
Once the payload is large, screenshots become noisy. Use jq or JSONPath to extract the fields that matter: IDs, status values, errors, duration, or retry count.
Use jq when you want to transform JSON. Use JSONPath when you want a selector-style expression that maps nicely to API testing, monitoring, and documentation examples.
jq: .errors[].code
JSONPath: $.errors[*].code

{
  "errors": [
    {"code": "CART_EXPIRED", "message": "Cart was updated"},
    {"code": "PAYMENT_RETRY_REQUIRED", "message": "Retry with a new intent"}
  ]
}Common mistakes this workflow catches
The Postman collection still calls a deprecated endpoint. The OpenAPI file documents 201 and 500 but not the 409 branch the frontend sees every day. The HAR waterfall shows that the backend is fast but a third-party script blocks the page. The HTTP response has cache headers that make an old schema stick in the browser.
These are the details that make the article useful. A generic diagram article would miss them.
Checklist before you publish the debugging note
Include one contract snippet, one request-order screenshot, one HAR timing screenshot, and one filtered response example. Mention which environment produced the data and whether the result is from local, staging, or production.
Keep raw source beside the preview. The screenshot helps readers scan, but the source lets another developer reproduce the result.